
Page Contents
How Current was the study?
The study was published on August 6,2021 as an MMWR Early Release.
Is there a source?
This study was conducted from May-June, 2021 in Kentucky. The first thing you want to look for when you see a news article, or a headline, is to see if you can navigate to a source – including this blog.
If a source is not cited, the author could be giving you opinions or leading you toward their end goal. So here’s a citation to the source for this study. Please take time to go look at it yourself after you read this blog post.
Citation
Cavanaugh AM, Spicer KB, Thoroughman D, Glick C, Winter K. Reduced Risk of Reinfection with SARS-CoV-2 After COVID-19 Vaccination — Kentucky, May–June 2021. MMWR Morb Mortal Wkly Rep 2021;70:1081-1083. DOI: http://dx.doi.org/10.15585/mmwr.mm7032e1external icon.
Primary or Secondary Dataset
In every study, you want to look for the source of the data. A Primary Dataset is a dataset that was acquired by the people doing the research. If the researcher created a survey, or went door-to-door, or administered the acquisition of the data, than the dataset is a Primary dataset.
If the researcher received access to a database that already existed, or were given files that someone else put together, the dataset is considered a secondary dataset.
There are many aspects of this that a reader should consider, including biases, the way the dataset was originally compiled, etc… A Primary Dataset for research, tends to be better known by the researcher, because they created the mechanisms to collect the data. But with Primary datasets come the possibility for the researcher to introduce bias into the study by using, for example, leading questions in a survey.
In the case of this study, the researchers used a Secondary Dataset provided by Kentucky’s National Electronic Disease Surveillance System (NEDSS). I’m not familiar with NEDSS, and have no reason not to trust the NEDSS system. But it’s worth acknowledging that there could be biases or flaws within the system itself on how NEDSS acquires and compiles data. A review on NEDSS would be it’s own blog post, and perhaps many.
So NEDSS has COVID infection data, as well as other attributes about the patients, presumably demographics and comorbidities that would be helpful for researchers of the study.
The researchers queried the data from NEDSS and put it into a REDCap database – REDCap is a system built in 2004 by Vanderbilt University and is an application used by many health systems for research including Spectrum Health.
How was the sample collected?
A sample for research could be an organic specimen or it could be a group of people. Regardless, a sample is intended to represent a broader group or population. The sample itself could introduce bias, if for example, it doesn’t represent the population. In Covid studies, for example, a researcher could pull a sample of patients that are elderly with multiple comorbidities and suggest that their findings apply to the whole population.
So it’s important that researchers include in their reports any biases that exist, and describe in detail how they collected their sample. In cases of human research, key information about the sample should be provided to understand how it may or may not represent a population.
In this study, the actual query is not included, but a description of the filtering criteria for data moved from NEDSS into REDCap are included and are as follows:
- Kentucky Residents
- Older than 18
- With a prior SARS-COV-2 (COVID) Infection that was confirmed by a positive nucleic acid amplification test (NAAT) or antigen test results.
- Reported in Kentucky’s NEDSS system from March-December 2020.
The REDCap database includes laboratory test results, case investigation data, dates of death for patients who are deceased as reported to public health authorities.
Once the data was in REDCap, additional filtering was applied as follows for the case sample:
- Previously infected persons
- **EXCLUDING COVID-19 cases that resulted in death before May 1, 2021.
- Kentucky Resident
- Laboratory confirmed SARS-COV-2 infection in 2020
- With a subsequent positive NAAT or antigen test result between May 1st and June 30th, 2021. These reinfection dates were selected because vaccine supply and eligilibity requirements were considered. Because of vaccine availability, people were more likely to have been able to choose and been able to receive the vaccine prior to this period.
In addition to the case sample, a control sample is also needed to compare outcomes. The criteria for the control study included the following:
- Kentucky Residents
- Laboratory confirmed SARS-COV-2 infection in 2020
- Who were not re-infected through June 30, 2021
In summary, the case sample are people who had COVID-19 in 2020, and then had it again in 2021. The control sample are people who had COVID-19 in 2020, and did not get it again in 2021.
The researchers matched Case-patients with Control-patients on a 1:2 ratio based on a matched gender, a matched age (within 3 years), and a matched date of the initial positive SARS-COV-2 test (within 1 week). This last date match is based on specimen collection date. If the collection date didn’t exist, the NEDSS report date was used. When there were multiple (more than 2) Control-patients for a given Case-patient, a random matching was performed. I interpret that to mean that when there were multiple Control-patients, for example 20, that matched a Case-patient, the researchers didn’t hand-pick 2 vaccinated cases or introduce some sort of selection bias.
What were the findings?
One of the key Independent variables for this study is Vaccination Status. The variable was determined using Kentucky’s Immunization Registry (KYIR). The study doesn’t necessarily call this out, but this is a second data source where bias could potentially exist. Presumably this dataset was loaded into REDCap as well. Case-patients and Control-patients were matched with the KYIR database using first and last name, and date of birth. Vaccination Status was determined based on the following criteria:
Case-patients were considered “Fully Vaccinated” if a single dose of the Johnson & Johnson vaccine or a second dose of either the Pfizer-BioNTech or Moderna vaccine was received more than 13 days before the reinfection date. For Control-patients, the same definition applies, but using the reinfection date of the matched case-patient rather than the reinfection date of the Control-patient, because the Control-patients don’t have a reinfection date.
Case-patients were considered “Partially Vaccinated” if one or more doses of a any of the 3 vaccines were administered, but either the vaccination series was not complete or the final dose was received less than 14 days before the case-patient’s reinfection date. The same definition applies to Control-patients, again, using the Case-patient’s reinfection date.
Case-patients and Control-patients were considered “Not Vaccinated” if no doses of any of the 3 vaccines were administered.
The researchers used SAS, which is a well known application used for statistical analysis, and ORs (Odds Ratios) and CIs (Confidence Intervals) were used to compare full, partial, and non vaccinated Case and Control patients. The research was reviewed by the CDC and according to the study, was conducted according to applicable federal law and CDC policy. No additional information is given on what that means.
The result were 246 case-patients matched by age, sex, and date of initial infection, with 492 control-patients. For case-patients, 149 (60.6%) were female, and 97 (39.4%) were male. 204 (82.9%) of the case patients were infected initially in 2020.
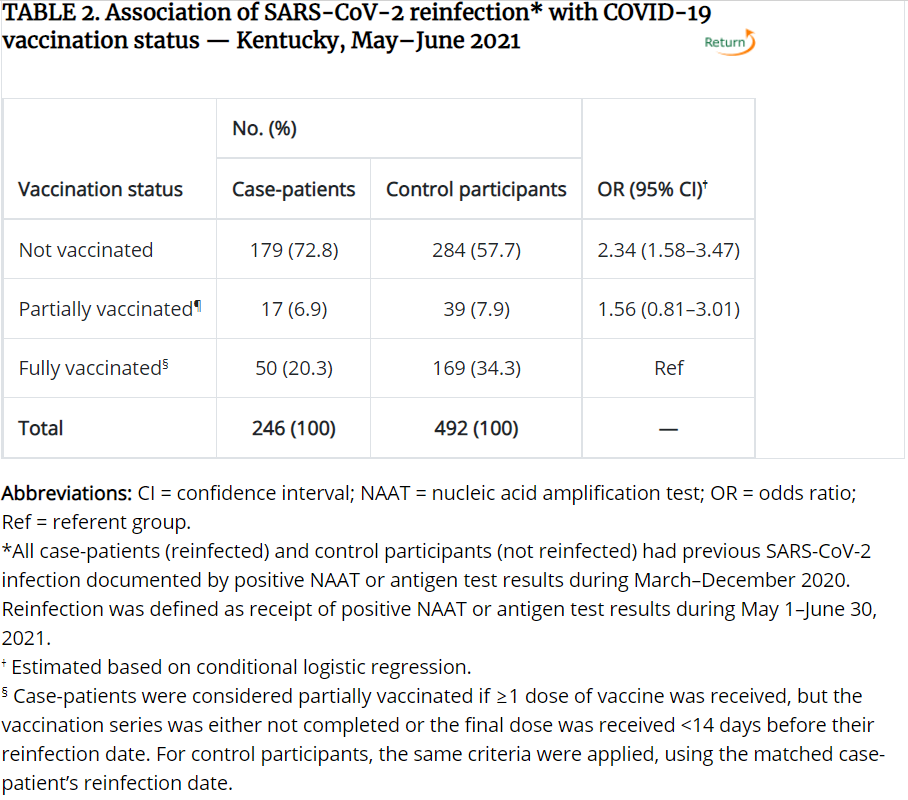
50 (20.3%) of the Case-patients were fully vaccinated, while 169 (34.3%) of the Control-patients were fully vaccinated. For context, an unnoticeable difference between unvaccinated and vaccinated individuals would be a 1:2 ratio so 50 Case-patients, and 100 Control-patients being fully vaccinated. Below is the resulting table comparing vaccination status between Case and Control patients. This and other tables related to the study can be found here.
If you aren’t familiar with statistical analysis, you may not understand the terms Odds Ratios (OR) or Confidence Interval (CI). This article on NCBI does a good job explaining them, but I’ll try to simplify for you.
The Odds Ratio (OR) is measuring how Vaccination Status is associated with the Case (reinfected) and Control patients (non-reinfected). In laymen’s terms, what are the odds of a case patient (someone getting COVID twice) being unvaccinated vs. the odds of a case patient being vaccinated, and how do those odds compare to those of the Control participants (people who were not reinfected). There are basically 3 outcomes for the OR:
- OR = 1, or is very close to 1, Vaccination Status has no measurable impact on reinfection.
- OR > 1, Vaccination Status has a higher impact on reinfection
- OR < 1, Vaccination Status has a lower impact on reinfection
Confidence Interval when it’s used with Odds Ratios, provide an estimate of precision. 95% refers to a bell-curve, where the bottom (left-side) 2.5% of the bell-curve, and the top (right-side) 2.5% of the bell-curve are chopped off, and the remaining 95% are within the normal distribution.
So for the table above, you can see the OR for the Unvaccinated row is 2.34, which means the odds are 2.34% higher for an unvaccinated person to get reinfected, than for a vaccinated person to get reinfected, based on this sample population. The CI is 1.58-3.47. Since it’s much larger than 1, the odds are considered more accurate or more precise. If the CI were less than 1 or 1, or the range for the CI spans 1, we would say the odds are not as precise. That’s why the study doesn’t conclude with a difference in partial vaccination, even though the odds ratio is 1.56.
The last row, Fully Vaccinated, as Ref for the OR/CI because that is the point of reference for the odds and CI’s of the other rows.
What are the limitations?
Thorough research, and the corresponding write-up will almost always include limitations of the study. This study indicated 5, which I’ve summarized below. You’ll note there are more than 5, because the study grouped a few together.
- Reinfection wasn’t confirmed through genome sequencing, meaning reinfection data may have been inaccurate.
- Persons who have been vaccinated are possibly less likely to get tested. So the researchers acknowledge that the association between reinfection and lack of vaccination might be overestimated.
- Vaccines administered at federal or out of state sites aren’t typically entered into KYIR, so vaccination data could be missing for both the case and control patients.
- Inconsistencies in name and date of birth between KYIR and NEDSS may limit the ability to match between the two databases. – so the study may understate the total number of people vaccinated because it couldn’t match a vaccination record with the participants of the study.
- KYIR might have been being updated, or delayed to the point that during research, up-to-date vaccination information may not have yet been entered at the time of the study.
- Even though age, gender, and date of initial infection were used for matching, there are likely other unknown confounding factors that might be present. The study doesn’t indicate those factors, but additional demographics like socio-economic factors, health factors such as comorbidities, geographic region, community events, and seasonal factors might also be worth considering.
- The study is retrospective using data from a single state during a 2 month period, “therefore, these findings cannot be used to infer causation.” The researchers themselves suggest, “additional prospective studies with larger populations are warranted to support these findings.”
What you should consider
I intend to be objective in my analysis of each study, and want to provide a simple summary of things to consider. Based on research I’ve conducted, there are several things to look for in any study or a news article.
- Did they cite a source and can you navigate to it? 9/10. I would give a 10/10 if I could actually get my hands on the dataset itself. With human research, it’s very common to protect the dataset being used for research for many obvious reasons. Researchers conducting research on humans or health information are provided deidentified data-sets, typically, which allow them to study the data without knowing who the actual people being studied, are.
- Did the source clearly describe how the data was acquired. 7/10. They could have provided the keyword logic and filtering criteria. They could have also done a better job of describing the two data-sets much more clearly.
- Did the source cite potential biases or limitations to the study? 7/10. They described 5 potential limitations which I described above. I thought they could do a better job of identifying source data limitations, case/control matching limitations etc. They did not describe the validity or reliability of their research – in other words, has the same type of research been conducted elsewhere that would show they are following precedented protocols?
- Is the source reputable? 9/10. The CDC has long been a reputable source for human research studies. There are potential biases, given the source of CDC funding, executive and media biases along with public opinion, etc. The researchers conducting the research are really the sources for the study, and without further investigation into each one specifically, professionally I would not suspect intentional researcher bias.
- We’re there enough participants in the sample? 5/10. The sample size has an N > 32, which is often the threshold to meet statistical significance. If that were the only measure, I would have given this a 10 out of 10. The other thing you must consider is what population the sample size can actually be inferred to represent. This study had 246 case-patients and 492 control-participants from the State of Kentucky based on a few months of initial infection in 2020 and a few months of reinfection in 2021. An astute observer would understand that that small population doesn’t represent, for example, a population of homeschoolers in Texas, or Antifa members in Portland, OR. The news would state unashamedly that unvaccinated persons are 2.3 times more likely to get COVID than vaccinated persons, but truthfully that is only 100% accurate of the persons included in this study. I would not consider the sample representative of the population of State of Kentucky let alone all Americans.
- Did the study or news article focus on one finding and not talk about other findings that are obviously visible in the study? 3/10. The study included tables for gender, age, and infection dates, as well as vaccination status, what it didn’t show were the vaccination status applied to gender, age, and infection dates. It would be helpful to understand if there were differences in vaccination status outcomes (reinfection) for case and control participants based on age. For example, if the majority of the Not Vaccinated are under the age of 50, that could be indicative of other age related factors, such as high-school graduations, weddings, and other events that could be the cause of gatherings and/or reinfections. Additionally, and maybe more important, is that 50 vaccinated individuals, out of 246, were reinfected with COVID. That’s 20% of the sample, which is not discussed at all. What are the odds that 20% of a random sample of reinfected patients from the State of Kentucky are vaccinated.
- Are all the variables included that you think are necessary to arrive at the same conclusion, or at least identified as limitations? 3/10. There are so many other factors that play into reinfection including geography, seasons (i.e. gatherings and community events), comorbidities, personal preferences for social distancing and guideline adherence, socioeconomic factors, etc. Looking only at age and gender are not enough. Gender, in fact, isn’t really described at all in the study. It would be interesting to see how vaccination rates differed between case and control patients based on gender.
- Is the study clearly described to the point that it could be reproduced by someone else given the same data and research background? 8/10. They could have been much more descriptive to make the study repeatable including the specifics of their filtering logic, better descriptions of their variables, and how they conducted the logistic regression.
My conclusion
Overall, I don’t think the findings should be ignored. Given a small sample of participants and the described factors of the study, the findings did show that statistically, unvaccinated people are more likely to get a reinfection than people without one. However, there are a number of variables not described or included in the study that significantly reduce the population size this sample represents. Additionally, 20% of the case-patients were re-infected after vaccination. That should also not be ignored, and is perhaps even more alarming for those who are vaccinated.
Based solely on this study, and the significant and varied unknown variables, I would not take seriously the assertion that all unvaccinated individuals are more likely to get re-infected with COVID than vaccinated individuals. If I lived in Kentucky, and knew more about the lifestyles, demographics, and events of the sample participants, and my lifestyle, demographics, and events were similar, the study outcomes would more likely apply to me. The same is true for you.
Working through this with your team?
This is exactly what we do at Stephens Insight Group helping organizations develop leaders, build strategy, and fix culture.
Talk to us about your organization
Some doctors , epidemiologist reviewed and found some other concerns as well
the unvaccinated cohort had a longer time between infection and reinfection , so reality is they need to wait and check vaccinated the same period of delay due to waning that is natural in all immunity see https://www.youtube.com/embed/tGli1N1gNOs
See https://www.powerlineblog.com/archives/2021/08/more-voodoo-epidemiology-at-the-cdc.php for other concerns by a number of professionals in the field