Page Contents
The study was published on August 6,2021 as an MMWR Early Release.
This study was conducted from May-June, 2021 in Kentucky. The first thing you want to look for when you see a news article, or a headline, is to see if you can navigate to a source – including this blog.
If a source is not cited, the author could be giving you opinions or leading you toward their end goal. So here’s a citation to the source for this study. Please take time to go look at it yourself after you read this blog post.
Cavanaugh AM, Spicer KB, Thoroughman D, Glick C, Winter K. Reduced Risk of Reinfection with SARS-CoV-2 After COVID-19 Vaccination — Kentucky, May–June 2021. MMWR Morb Mortal Wkly Rep 2021;70:1081-1083. DOI: http://dx.doi.org/10.15585/mmwr.mm7032e1external icon.
In every study, you want to look for the source of the data. A Primary Dataset is a dataset that was acquired by the people doing the research. If the researcher created a survey, or went door-to-door, or administered the acquisition of the data, than the dataset is a Primary dataset.
If the researcher received access to a database that already existed, or were given files that someone else put together, the dataset is considered a secondary dataset.
There are many aspects of this that a reader should consider, including biases, the way the dataset was originally compiled, etc… A Primary Dataset for research, tends to be better known by the researcher, because they created the mechanisms to collect the data. But with Primary datasets come the possibility for the researcher to introduce bias into the study by using, for example, leading questions in a survey.
In the case of this study, the researchers used a Secondary Dataset provided by Kentucky’s National Electronic Disease Surveillance System (NEDSS). I’m not familiar with NEDSS, and have no reason not to trust the NEDSS system. But it’s worth acknowledging that there could be biases or flaws within the system itself on how NEDSS acquires and compiles data. A review on NEDSS would be it’s own blog post, and perhaps many.
So NEDSS has COVID infection data, as well as other attributes about the patients, presumably demographics and comorbidities that would be helpful for researchers of the study.
The researchers queried the data from NEDSS and put it into a REDCap database – REDCap is a system built in 2004 by Vanderbilt University and is an application used by many health systems for research including Spectrum Health.
A sample for research could be an organic specimen or it could be a group of people. Regardless, a sample is intended to represent a broader group or population. The sample itself could introduce bias, if for example, it doesn’t represent the population. In Covid studies, for example, a researcher could pull a sample of patients that are elderly with multiple comorbidities and suggest that their findings apply to the whole population.
So it’s important that researchers include in their reports any biases that exist, and describe in detail how they collected their sample. In cases of human research, key information about the sample should be provided to understand how it may or may not represent a population.
In this study, the actual query is not included, but a description of the filtering criteria for data moved from NEDSS into REDCap are included and are as follows:
The REDCap database includes laboratory test results, case investigation data, dates of death for patients who are deceased as reported to public health authorities.
Once the data was in REDCap, additional filtering was applied as follows for the case sample:
In addition to the case sample, a control sample is also needed to compare outcomes. The criteria for the control study included the following:
In summary, the case sample are people who had COVID-19 in 2020, and then had it again in 2021. The control sample are people who had COVID-19 in 2020, and did not get it again in 2021.
The researchers matched Case-patients with Control-patients on a 1:2 ratio based on a matched gender, a matched age (within 3 years), and a matched date of the initial positive SARS-COV-2 test (within 1 week). This last date match is based on specimen collection date. If the collection date didn’t exist, the NEDSS report date was used. When there were multiple (more than 2) Control-patients for a given Case-patient, a random matching was performed. I interpret that to mean that when there were multiple Control-patients, for example 20, that matched a Case-patient, the researchers didn’t hand-pick 2 vaccinated cases or introduce some sort of selection bias.
One of the key Independent variables for this study is Vaccination Status. The variable was determined using Kentucky’s Immunization Registry (KYIR). The study doesn’t necessarily call this out, but this is a second data source where bias could potentially exist. Presumably this dataset was loaded into REDCap as well. Case-patients and Control-patients were matched with the KYIR database using first and last name, and date of birth. Vaccination Status was determined based on the following criteria:
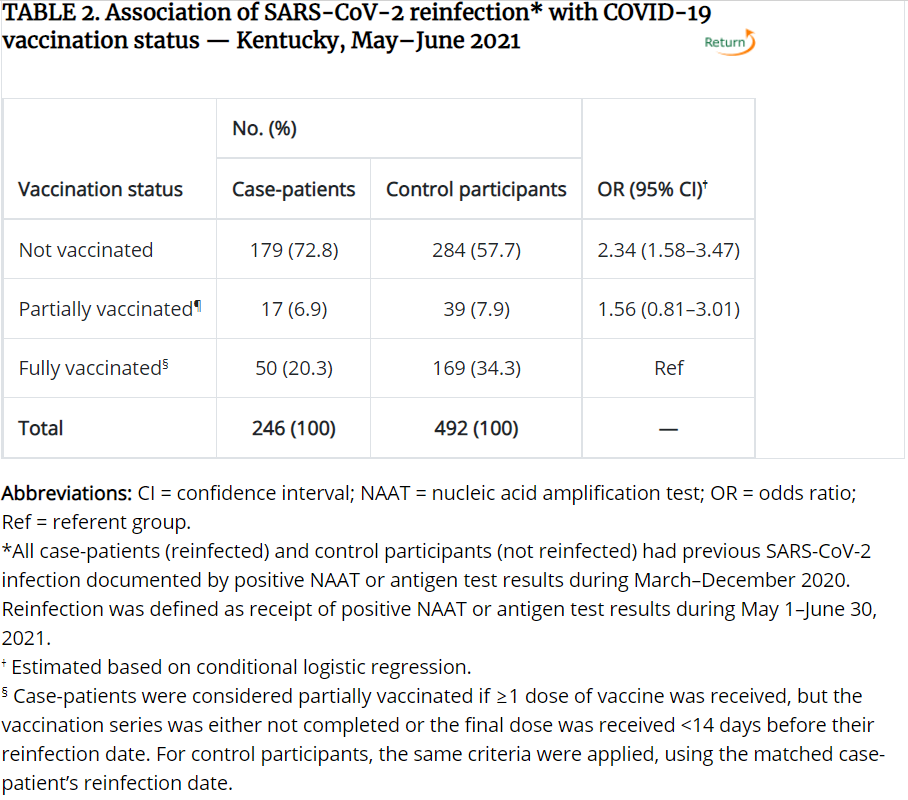
Case-patients were considered “Fully Vaccinated” if a single dose of the Johnson & Johnson vaccine or a second dose of either the Pfizer-BioNTech or Moderna vaccine was received more than 13 days before the reinfection date. For Control-patients, the same definition applies, but using the reinfection date of the matched case-patient rather than the reinfection date of the Control-patient, because the Control-patients don’t have a reinfection date.
Case-patients were considered “Partially Vaccinated” if one or more doses of a any of the 3 vaccines were administered, but either the vaccination series was not complete or the final dose was received less than 14 days before the case-patient’s reinfection date. The same definition applies to Control-patients, again, using the Case-patient’s reinfection date.
Case-patients and Control-patients were considered “Not Vaccinated” if no doses of any of the 3 vaccines were administered.
The researchers used SAS, which is a well known application used for statistical analysis, and ORs (Odds Ratios) and CIs (Confidence Intervals) were used to compare full, partial, and non vaccinated Case and Control patients. The research was reviewed by the CDC and according to the study, was conducted according to applicable federal law and CDC policy. No additional information is given on what that means.
The result were 246 case-patients matched by age, sex, and date of initial infection, with 492 control-patients. For case-patients, 149 (60.6%) were female, and 97 (39.4%) were male. 204 (82.9%) of the case patients were infected initially in 2020.
50 (20.3%) of the Case-patients were fully vaccinated, while 169 (34.3%) of the Control-patients were fully vaccinated. For context, an unnoticeable difference between unvaccinated and vaccinated individuals would be a 1:2 ratio so 50 Case-patients, and 100 Control-patients being fully vaccinated. Below is the resulting table comparing vaccination status between Case and Control patients. This and other tables related to the study can be found here.
If you aren’t familiar with statistical analysis, you may not understand the terms Odds Ratios (OR) or Confidence Interval (CI). This article on NCBI does a good job explaining them, but I’ll try to simplify for you.
The Odds Ratio (OR) is measuring how Vaccination Status is associated with the Case (reinfected) and Control patients (non-reinfected). In laymen’s terms, what are the odds of a case patient (someone getting COVID twice) being unvaccinated vs. the odds of a case patient being vaccinated, and how do those odds compare to those of the Control participants (people who were not reinfected). There are basically 3 outcomes for the OR:
Confidence Interval when it’s used with Odds Ratios, provide an estimate of precision. 95% refers to a bell-curve, where the bottom (left-side) 2.5% of the bell-curve, and the top (right-side) 2.5% of the bell-curve are chopped off, and the remaining 95% are within the normal distribution.
So for the table above, you can see the OR for the Unvaccinated row is 2.34, which means the odds are 2.34% higher for an unvaccinated person to get reinfected, than for a vaccinated person to get reinfected, based on this sample population. The CI is 1.58-3.47. Since it’s much larger than 1, the odds are considered more accurate or more precise. If the CI were less than 1 or 1, or the range for the CI spans 1, we would say the odds are not as precise. That’s why the study doesn’t conclude with a difference in partial vaccination, even though the odds ratio is 1.56.
The last row, Fully Vaccinated, as Ref for the OR/CI because that is the point of reference for the odds and CI’s of the other rows.
Thorough research, and the corresponding write-up will almost always include limitations of the study. This study indicated 5, which I’ve summarized below. You’ll note there are more than 5, because the study grouped a few together.
I intend to be objective in my analysis of each study, and want to provide a simple summary of things to consider. Based on research I’ve conducted, there are several things to look for in any study or a news article.
Overall, I don’t think the findings should be ignored. Given a small sample of participants and the described factors of the study, the findings did show that statistically, unvaccinated people are more likely to get a reinfection than people without one. However, there are a number of variables not described or included in the study that significantly reduce the population size this sample represents. Additionally, 20% of the case-patients were re-infected after vaccination. That should also not be ignored, and is perhaps even more alarming for those who are vaccinated.
Based solely on this study, and the significant and varied unknown variables, I would not take seriously the assertion that all unvaccinated individuals are more likely to get re-infected with COVID than vaccinated individuals. If I lived in Kentucky, and knew more about the lifestyles, demographics, and events of the sample participants, and my lifestyle, demographics, and events were similar, the study outcomes would more likely apply to me. The same is true for you.
Humans are truly remarkable—we’ve landed on the moon, taught machines to compose music, and created…
I think it's safe to say that AI has hit the world stage by storm.…
It's one of those things that sounds too good to be true. Working from home.…
Jim Rohn said, “you are the average of the five people you spend the most…
Merry Christmas! This is my absolute favorite time of year. It has a feel to…
There were 30-ish doctoral candidates standing on a street corner just outside of Washington DC. …