Page Contents
The study was published on August 6, 2021 as an MMWR Early Release. MMWR is the Morbidity and Mortality Weekly Report from the CDC.
This study was conducted in late July or early August, 2021. This article is straight from the CDC and contains the details of the study.
Brown CM, Vostok J, Johnson H, et al. Outbreak of SARS-CoV-2 Infections, Including COVID-19 Vaccine Breakthrough Infections, Associated with Large Public Gatherings — Barnstable County, Massachusetts, July 2021. MMWR Morb Mortal Wkly Rep 2021;70:1059-1062. DOI: http://dx.doi.org/10.15585/mmwr.mm7031e2external icon.
This study was based on two Secondary Datasets, specifically the Massachusetts state immunization registry, and travel history data from the state’s COVID-19 surveillance system.
Let’s talk a little bit about what a sample is, and then I’ll share more about the sample for this study.
Remember from my previous review, that the sample is intended to represent a larger group – or put differently, it’s intended to be a part that represents some whole.
If our sample, for example were made up of 50 pregnant women, the population those 50 pregnant women represent likely would be limited to the female population, more specifically, pregnant females.
But what if the fact that the women were pregnant had nothing to do with the study? To better understand the population that is represented, you have to know more about the sample and about the study. Perhaps pregnant women were easier to survey for the researcher, and perhaps the pregnant women are all Hispanic. We would infer based on that additional information that the represented population could be all Hispanic females.
You have to understand the sample, the biases that influenced the sample, and the nature of the study to understand what population that sample represents. As we look at COVID research, or any research for that matter, the sample matters, and is almost always overlooked by the media.
Hispanic pregnant women have nothing to do with this study, but I think it’s important for you to understand what a sample is, and how to really think about the population that sample represents.
The sample was collected by the MA Department of Public Health. They looked at the state’s COVID-19 surveillance system data, queried/identified a group of residents that clustered together geographically, and then matched that up with the state’s immunization registry.
The reason the MA DPH looked into the data in this manner was because on July 3rd, 2021, the 14-day average COVID-19 incidence of zero cases per 100,000 persons per day in residents of a town in Barnstable County jumped up to 177 cases per 100,000 persons per day by the 17th. In other words, a lot changed in 2 weeks – 0 cases per day to 177 cases per day for a single town. According to the US Census Bureau, Barnstable Town, MA has a population of about 44,477 in 2019. So .4% of the population were testing positive for SARS-CoV-2 each day.
The criteria they used to identify a cluster case was as follows:
Breakthrough cases are defined as fully vaccinated Massachusetts residents (those documented within the state immunization registry of completion of COVID-19 vaccination 14 or more days prior to exposure. Unlike the previous study I reviewed, the MA DPH used whole genome sequencing through the MA State Public Health Laboratory or the Broad Instituted of MIT and Harvard University. They obtained 211 specimens for testing and then on July 15th the MA DPH issued two notifications to identify additional cases.
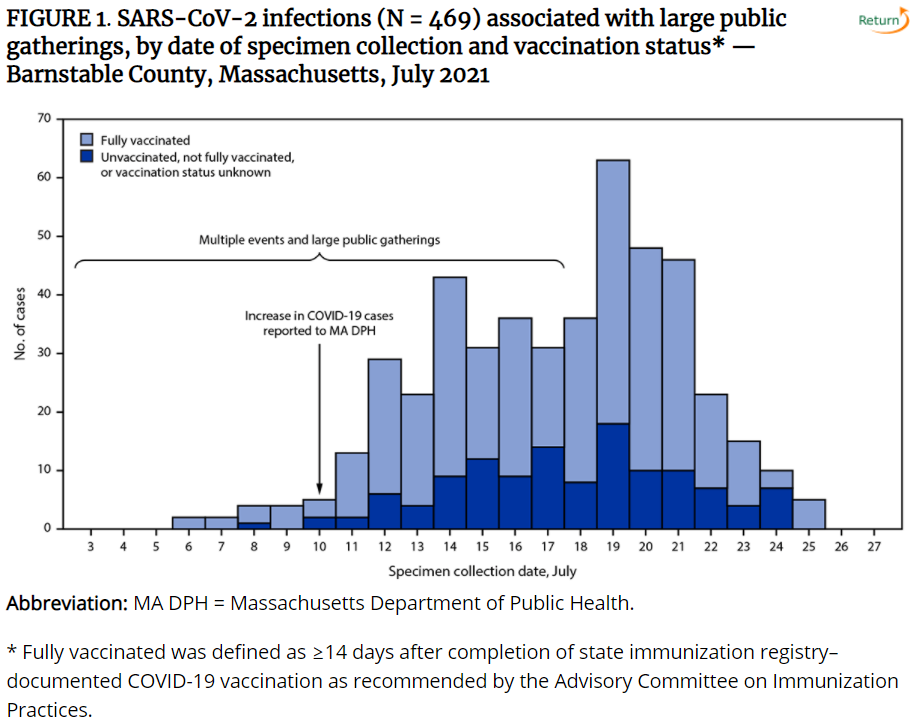
By July 26th, 469 COVID-19 cases were identified with positive specimen collections between July 6th and July 25th.
In short, the MA Department of Health noticed a significant uptick in positive COVID testing for a specific town, and then looked at recent events and geographies to identify people who came into contact with one another. These are the 469 people included in this study.
Below is a figure that shows days a specimen was collected for testing across the bottom, with the height of the bars representing the number of cases. The Stacked Bar chart shows fully vaccinated individuals as light blue, and unvaccinated or not fully vaccinated as blue bars.
You can tell by the graphic that the number of cases rose quickly, and that the number of vaccinated individuals significantly outnumber the unvaccinated individuals.
So now for some stats.
Here’s where things get interesting.
Now, let’s talk about the 5 people that were hospitalized
In short, more vaccinated people were impacted by this outbreak than unvaccinated, and 4 of the 5 hospitalized were vaccinated. If you look closely at the details about the 4 people hospitalized, you’ll note that at least one of them was in their 20s and two of them had no underlying medical conditions.
The study listed 4 limitations.
I think this is a great example where the media focuses on headlines that match their agenda. I think a lot of people who have strong opinions about requiring people to be vaccinated, have totally missed and/or completely dismissed studies like this.
Longitudinal health research (or in other words, health research that requires time to pass) for COVID is severely limited. The pandemic started a little over a year ago, and the vaccine has only been out for about 8 months. That’s a very short amount of time to study the impacts of the virus, and the efficacy and effectiveness of a trial vaccine. It’s certainly not enough time to understand the long-term impact of the vaccine.
As a middle-aged male, this study gives me pause for obvious reasons. If you are vaccinated, is there an increased risk? Or were there just not many unvaccinated people at the event? If you are unvaccinated, does this study make a case for getting vaccinated?
Additionally, I want to point out that this is a delta variant. Another study I’ve seen lately is about the enhanced immunity of vaccinated individuals over the natural immunity of those who have had COVID – specifically enhanced immunity for other strains of the virus. This study doesn’t seem to indicate an enhanced immunity against variants for vaccinated individuals. To the contrary, it indicated that the viral load seemed to be the same. Keep in mind though, that we don’t know the extent of symptoms, and the study didn’t really compare the symptomatic severity of cases.
Also, there really wasn’t a difference between the types of vaccine. It wasn’t like one of them was way better than the other two. I haven’t seen claims to one being better than another, but it would have been interesting if that were the case. The percentage differences I listed above are really just informative of who had which vaccine.
Lastly, I’d really like to know more about the men included in the sample. If you know what events were tied to this study, please comment below. If I find out, I’ll come back and edit this for future readers. I think those details would help us better understand whether this study applies or could be representative of you and me.
Humans are truly remarkable—we’ve landed on the moon, taught machines to compose music, and created…
I think it's safe to say that AI has hit the world stage by storm.…
It's one of those things that sounds too good to be true. Working from home.…
Jim Rohn said, “you are the average of the five people you spend the most…
Merry Christmas! This is my absolute favorite time of year. It has a feel to…
There were 30-ish doctoral candidates standing on a street corner just outside of Washington DC. …